Did California's Solar Mandate Increase Solar Adoption?
Estimating what would have happened without the policy.
California solar mandate series
-
Did California’s Solar Mandate Increase Solar Adoption? (current)
One question appears in almost every policy discussion.
Did the policy work?
It sounds simple.
In practice, it is surprisingly difficult to answer.
Suppose rooftop solar installations increase after California introduces a mandate.
Does that mean the mandate caused the increase?
Not necessarily.
Solar installation costs were changing. Electricity prices and utility tariffs were changing. Federal tax incentives remained available. California had been expanding rooftop solar for years before the statewide mandate took effect.
Simply comparing before and after cannot distinguish the effect of the mandate from all of these other changes.
Our goal was therefore slightly different.
Instead of asking whether solar adoption increased after 2020, we asked:
How much would adoption have increased even if California had never adopted the mandate?
Answering that question requires constructing a counterfactual.
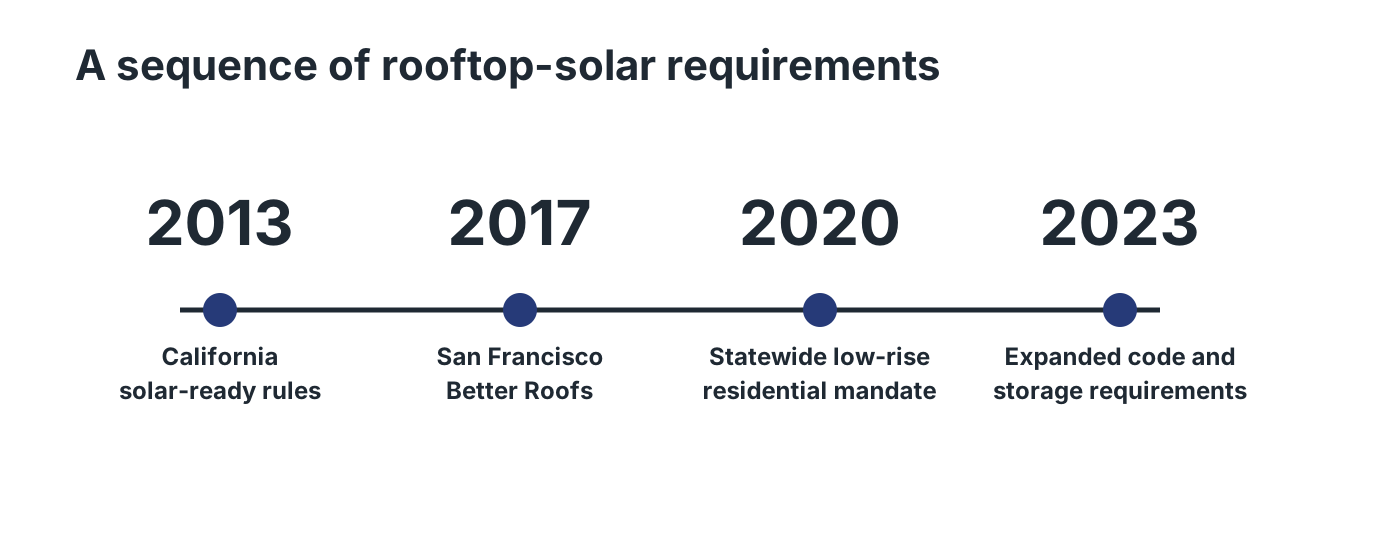
The problem of missing histories
Every policy evaluation faces the same challenge.
We observe what actually happened.
We never observe what would have happened otherwise.
California either adopted the mandate or it did not. History unfolds only once.
The challenge for empirical researchers is to estimate the missing alternative—the counterfactual.
Constructing a synthetic comparison
To estimate that counterfactual, we used synthetic control methods.
The basic idea is intuitive.
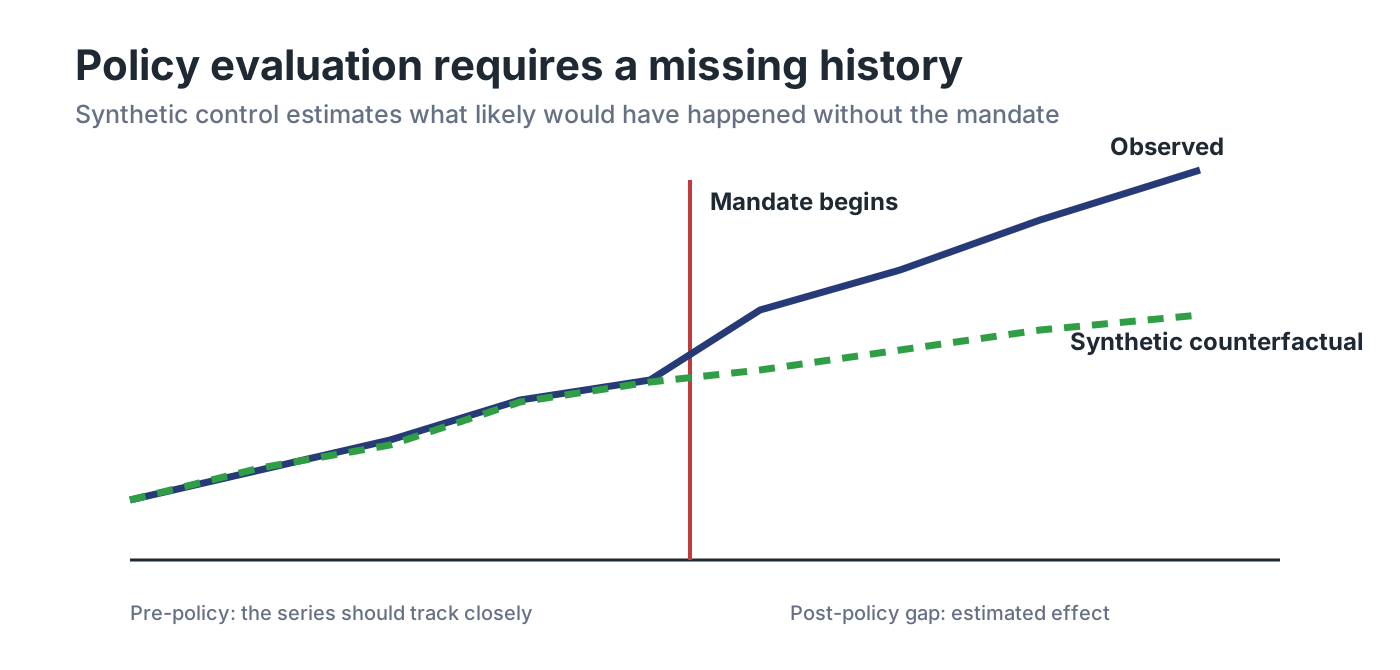
Rather than comparing the treated jurisdiction with any single untreated place, synthetic control constructs a weighted combination of other places that resembles it before the policy.
No individual city looks exactly like San Francisco, and no individual state looks exactly like California. But a weighted combination can sometimes closely reproduce pre-policy characteristics and outcome trends.
The resulting synthetic comparison provides an estimate of what adoption might have looked like without the mandate.
One advantage of the method is that readers can inspect the comparison directly. If the treated and synthetic series track one another before the policy and then diverge afterward, that pattern supports—but does not by itself prove—a causal interpretation.
San Francisco: directly observing solar on new buildings
San Francisco’s Better Roofs ordinance took effect in January 2017. It applied to new residential, commercial, and municipal buildings, with exemptions and alternative compliance pathways including solar thermal systems and living roofs.
For this analysis, we observe individual new-construction permits and whether residential projects installed rooftop solar. We construct synthetic San Francisco from a donor pool of 18 other Bay Area municipalities that had not yet adopted their own mandates.
The standard synthetic control places most of its weight on Oakland and San Jose. Before the policy, synthetic San Francisco tracks the city’s solar-adoption share reasonably well despite quarterly volatility.
After implementation, the series diverge.
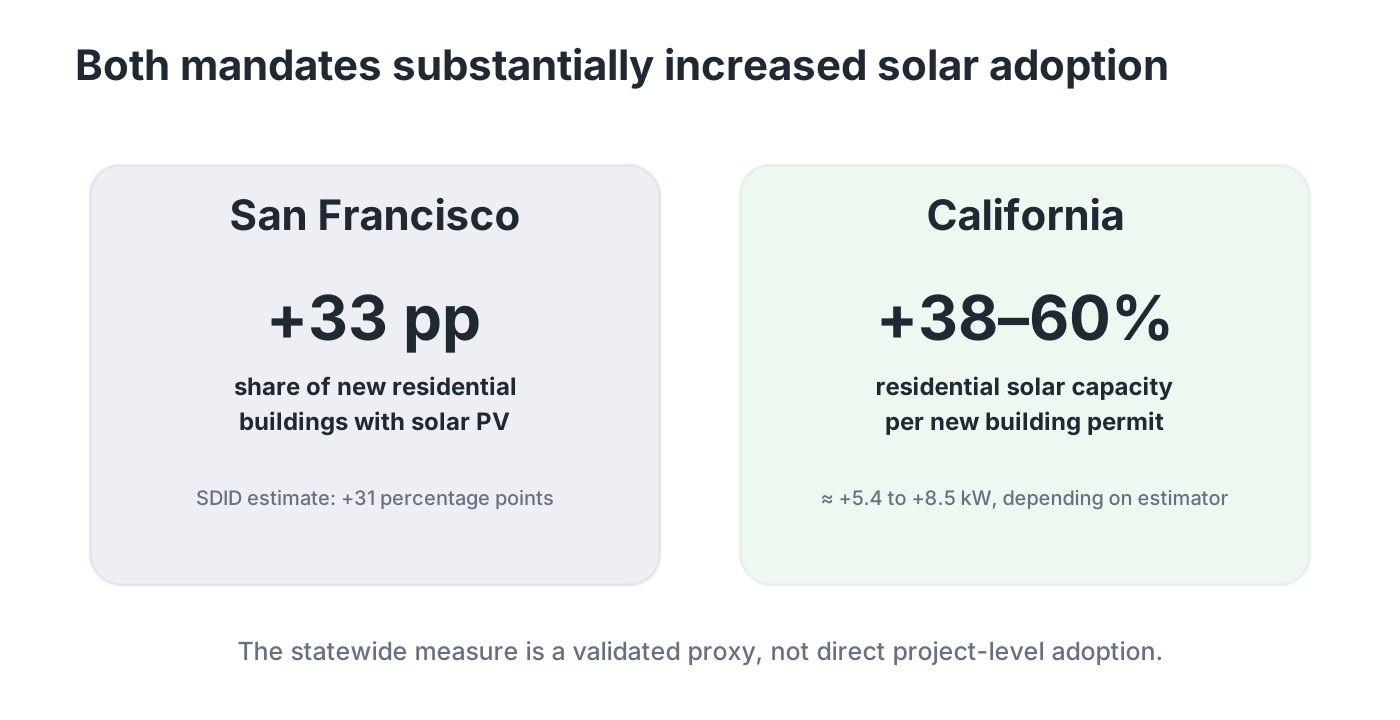
Our main synthetic-control estimate indicates that the ordinance increased the share of new residential buildings with rooftop solar by 33 percentage points, or about 120 percent relative to the pre-policy level. A complementary synthetic difference-in-differences estimator produces a similar effect of 31 percentage points, with a standard error of 9 percentage points.
Post-policy photovoltaic adoption was approximately 57 percent rather than 100 percent. That is consistent with the ordinance’s design: projects could qualify for exemptions or comply through solar thermal systems or living roofs.
When those pathways are considered, total verified compliance rises to roughly 80 to 85 percent by 2018–2019, and only a small remaining share cannot be verified as compliant or exempt.
California: using a proxy for new-construction adoption
The statewide mandate took effect in January 2020 for newly constructed low-rise residential buildings.
At the state level, however, we cannot directly observe the share of new homes that installed solar across California and all potential comparison states.
Instead, we construct a proxy outcome:
Total residential solar capacity additions per new residential building permit.
The numerator includes all residential solar capacity added in the state, including installations on existing homes. The denominator is an average of residential building permits issued several quarters earlier to account for the lag between permitting, construction, and solar interconnection.
This measure therefore should not be interpreted as the average system size installed on a newly constructed home.
It is a state-level proxy for whether residential solar capacity increased relative to the flow of new construction.
We validate this proxy using the Bay Area permit data. When applied to San Francisco’s citywide mandate, it produces a substantial post-policy increase consistent with the direct new-construction adoption measure.
What we found statewide
For the statewide analysis, synthetic control constructs a comparison primarily from New York and Hawaii in the monthly and quarterly specifications.
The estimates are consistent across time aggregations:
- the monthly synthetic-control model estimates an increase of 5.39 kilowatts, or 38 percent, per new residential building permit;
- the quarterly model estimates 6.38 kilowatts, or 45 percent; and
- synthetic difference-in-differences estimates 8.46 kilowatts, or 60 percent.
These magnitudes are in the range of the capacity of a typical residential photovoltaic system, although the outcome itself is a proxy and cannot be interpreted as a system installed directly on each new permit.
The methods differ in their comparison weights and identifying assumptions, but all point to the same qualitative conclusion:
California’s statewide mandate substantially increased residential solar capacity relative to new construction.
Why robustness matters
Synthetic-control estimates are only as credible as the counterfactual they construct.
The paper therefore includes several supporting analyses:
- pre-policy comparisons of the treated and synthetic series;
- balance tables for predictor variables;
- placebo tests that apply the same method to untreated cities and states;
- synthetic difference-in-differences estimates; and
- validation of the statewide proxy using the richer San Francisco permit data.
For both policies, the post-treatment increase stands out relative to placebo estimates, although the statewide outcome and comparison necessarily remain less direct than the building-level San Francisco analysis.
Increased adoption is not the end of the policy question
At this point, it would be tempting to conclude:
The mandate worked.
Our paper is more careful.
Increasing adoption answers one important question:
What changed because of the policy?
It does not answer every important question:
Was that change worth achieving through this particular policy?
A complete policy evaluation must also consider whether the additional installations generated private and social benefits sufficient to justify their costs, how much private value depended on tax credits and net-metering transfers, and how rooftop solar compares with alternatives such as utility-scale renewable generation.
Our engineering analysis finds generally positive private payoffs under the policies in place, but those returns depend substantially on transfers. Removing the federal Investment Tax Credit reduces the median estimated payoff by 41 percent; replacing net metering with a less valuable compensation policy reduces it by 58 percent; removing both reduces it by 75 percent.
The paper also notes that utility-scale solar can generally produce renewable electricity at lower capital cost, while rooftop solar may offer distinct distributed-generation or grid benefits.
The results therefore support a precise conclusion:
San Francisco’s and California’s mandates substantially increased rooftop solar adoption or capacity relative to their estimated no-policy counterfactuals.
Whether rooftop mandates are the most efficient way to increase renewable generation is a separate welfare question, and the paper finds limited support for preferring them to larger utility-scale projects on those grounds.
Measuring policy versus judging policy
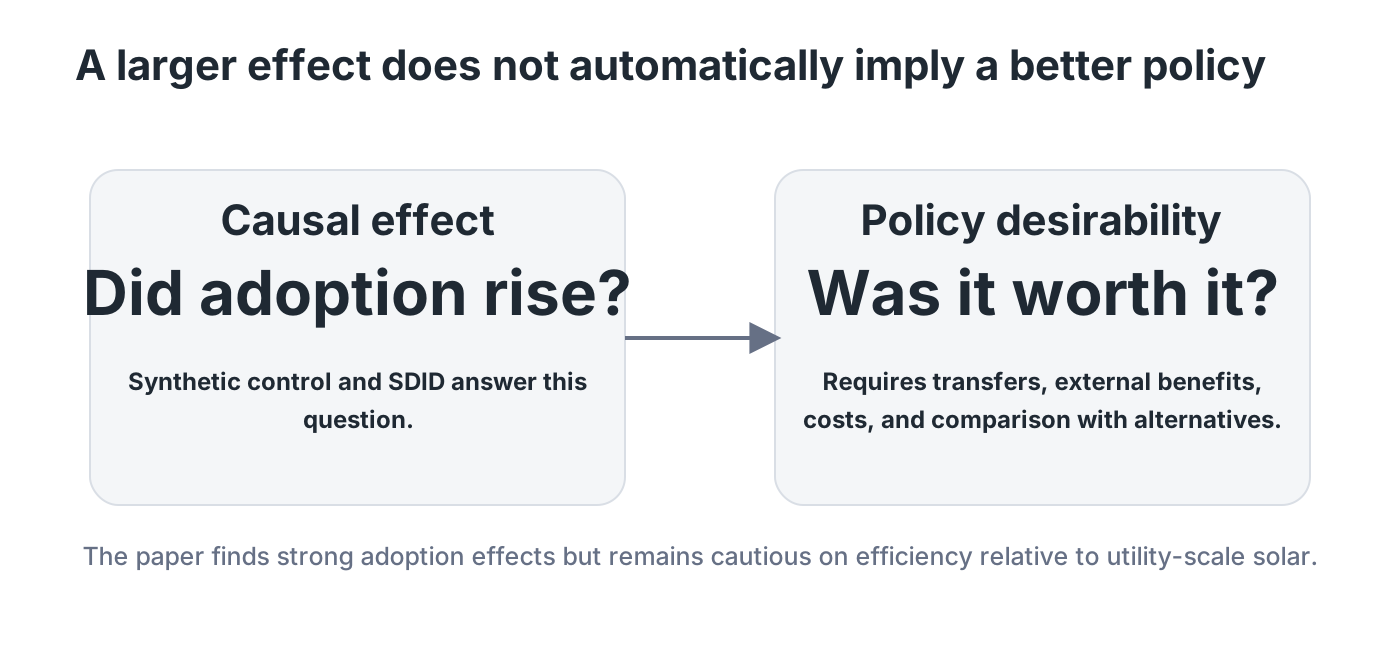
One lesson from this project is the importance of distinguishing estimating a policy effect from evaluating policy desirability.
The first asks what changed because of the policy.
The second asks whether that change was worth its full social cost and whether another policy could have achieved the same goal more efficiently.
Those questions are related, but they are not identical.
Our evidence provides a clear answer to the first: the mandates substantially increased solar adoption.
It also provides several inputs into the second—without pretending that a treatment-effect estimate alone settles the broader policy debate.
This post is based on Solar Adoption by Mandates, joint work with Stefano Carattini, Wade Davis, and Anton Heimerdinger. The full working paper includes the engineering model, policy details, robustness checks, placebo analyses, and supplemental results.
Previous: The Solar Gap
Return to the Solar Adoption by Mandates publication page.